Archive for the ‘Statistics’ Category.

Kolmogorov Student Olympiad in Probability

There are too many Olympiads. Now there is even a special undergraduate Olympiad in probability, called Kolmogorov Student Olympiad in Probability. It is run by the Department of Probability Theory of Moscow State University. I just discovered this tiny Olympiad, though it has been around for 13 years.

A small portion of the problems are accessible for high school students. These are the problems that I liked. I edited them slightly for clarity.

Second Olympiad. Eight boys and seven girls went to movies and sat in the same row of 15 seats. Assuming that all the 15! permutations of their seating arrangements are equally probable, compute the expected number of pairs of neighbors of different genders. (For example, the seating BBBBBBBGBGGGGGG has three pairs.)

Third Olympiad. One hundred passengers bought assigned tickets for a 100-passenger railroad car. The first 99 passengers to enter the car get seated randomly so that all the 100! possible permutations of their seating arrangements are equally probable. However, the last passenger decides to take his reserved seat. So he arrives at his seat and if it is taken he asks the passenger in his seat to move elsewhere. That passenger does the same thing: she arrives at her own seat and if it is taken, she asks the person to move, and so on. Find the expected number of moved passengers.

Third Olympiad. There are two 6-sided dice with numbers 1 through 6 on their faces. Is it possible to “load” the dice so that when the two dice are thrown the sum of the numbers on the dice are distributed uniformly on the set {2,…,12}? By loading the dice we mean assigning probabilities to each side of the dice. You do not have to “load” both dice the same way.

Sixth Olympiad. There are M green and N red apples in a basket. We take apples out randomly one by one until all the apples left in the basket are red. What is the probability that at the moment we stop the basket is empty?

Seventh Olympiad. Prove that there exists a square matrix A of order 11 such that all its elements are equal to 1 or −1, and det A > 4000.

Twelfth Olympiad. In a segment [0,1] n points are chosen randomly. For every point one of the two directions (left or right) is chosen randomly and independently. At the same moment in time all n points start moving in the chosen direction with speed 1. The collisions of all points are elastic. That means, after two points bump into each other, they start moving in the opposite directions with the same speed of 1. When a point reaches an end of the segment it sticks to it and stops moving. Find the expected time when the last point sticks to the end of the segment.

Thirteenth Olympiad. Students who are trying to solve a problem are seated on one side of an infinite table. The probability that a student can solve the problem independently is 1/2. In addition, each student will be able to peek into the work of his or her right and left neighbor with a probability of 1/4 for each. All these events are independent. Assume that if student X gets a solution by solving or copying, then the students who had been able to peek into the work of student X will also get the solution. Find the probability that student Vasya gets the solution.

Share:Facebooktwitterredditpinterestlinkedinmail
IQ Migration

The Russian website problems.ru has a big collection of math problems. I use it a lot in my work as a math Olympiad coach. Recently I was giving a statistics lesson. While there was only one statistics problem on the website, it was a good one.

Assume that every person in every country was tested for IQ. A country’s IQ rating is the average IQ of the population. We also assume that for the duration of this puzzle no one is born and no one dies.

  • A group of citizens of country A emigrated to B. Show that the rating of both countries can go up.
  • After that a group of citizens of B (which may include former citizens of A) emigrated to A. Is it possible that the ratings of both countries go up again?
  • A group of citizens of A emigrated to B, and a group of citizens of B emigrated to C. As a result, the ratings of each country increased. After that the migration went the opposite way: some citizens of C moved to B, and some citizens from B moved to A. As a result, the ratings of all three counties went up once more. Is this possible? If yes, then how? If no, then why not?
Share:Facebooktwitterredditpinterestlinkedinmail

Reverse Bechdel Test

A movie passes the Bechdel Test if these three statements about it are true:

  • There are at least two named women in it
  • Who talk to each other
  • About something besides a man.

Surely there should be a movie where two women talk about the Bechdel test. But I digress.

The Bechdel test website rates famous movies. Currently they have rated 4,683 movies and 56% pass the test. More than half of the movies pass the test. There is hope. Right? Actually they have a separate list of the top 250 famous movies. Only 70 movies, or 28%, from this list pass the test.

My son Alexey suggested the obvious reverse Bechdel test, which is more striking than the Bechdel test. A movie doesn’t pass the test if it

  • Has at least two named men characters
  • Whenever they talk to each other
  • They only talk about women.

I can’t think of any movie like that. Can you?

Update (Sep 2023): I should have included the possibility that there are no two named male characters.

Share:Facebooktwitterredditpinterestlinkedinmail

Fraternal Birth Order and Fecundity

Two interesting research results about male homosexuality are intertwined. The first one shows that the probability of homosexuality in a man increases with the number of older brothers. That is, if a boy is the third son in a family, the probability of him being a homosexual is greater than the probability of a first son in a family being homosexual. The second research result shows that the probability of homosexuality increases with the number of children the mother has. So if a woman is fertile and has many children, the probability that each of her sons is a homosexual is greater than the probability that an only child is a homosexual.

Many people conclude from the first result that a woman undergoes hormonal or other changes while being pregnant with boys that influence the probability of future boys being homosexual. Looking at the second result, researchers conclude that homosexuality has a genetic component. Moreover, that component is tied up with the mother’s fecundity. The same genes are responsible for both the mother having many children and for her sons being homosexual. This assumption explains why homosexuality is not dying out in the evolution process.

In one of my previous essays I showed that the first results influences the second result. If each next son is homosexual with higher probability, then the more children a mother has the more probable it is that her sons are homosexuals. That means that the second result is a mathematical consequence of the first result. Therefore, the conclusion that the second result implies a genetic component might be wrong. The correlation between homosexuality and fecundity could be the consequence of hormonal changes.

Now let’s look at this from the opposite direction. I will show that the first result is the mathematical consequence of the second result: namely, if fertile women are more probable to give birth to homosexuals, then the probability that the second sons are is higher than the probability that the first sons are gay.

For simplicity let’s only consider mothers with one or two boys. Suppose the probability of a son of a one-son mother to be a homosexual is p1. Suppose the probability of a son of a two-sons mother to be a homosexual is p2. The data shows that p2 is greater than p1. What is the consequence? Suppose the number of mothers with one son is m1 and the number of mothers with two sons is m2. Then in the whole population the probability of a boy who is the first son to be gay is (p1m1+p2m2)/(m1+m2) and the probability of a boy who is the second son to be gay is p2. It is easy to see that the first probability is smaller than the second one.

Let me create an extreme hypothetical example. Suppose mothers of one son always have straight sons, and mothers of two sons always have gay sons. Now consider a random boy in this hypothetical setting. If he’s the second son, he is always gay, while if he is the first son he is not always gay.

We can conclude that if the probability of having homosexual sons depends on fecundity, then the higher numbered children would be gay with higher probability than the first-born. This means that if the genetics argument is true and being a homosexual depends on the mother’s fecundity gene, then it would follow mathematically that the probability of homosexuality increases with birth order. The conclusion that homosexuality depends on hormonal changes might not be valid.

So what is first, chicken or egg? Is homosexuality caused by fecundity, while birth order correlation is just the consequence? Or vice versa? Is homosexuality caused by the birth order, while correlation with fecundity is just the consequence?

What do we do when the research results are so interdependent? To untangle them we need to look at the data more carefully. And that is easy to do.

To show that homosexuality depends on the order of birth independently of the mother’s fertility, we need to take all the families with two boys (or the same number of boys) and show that in such families the second child is more probable to be homosexual than the first child.

To show the dependence on fertility, without the influence of the birth order, we need to take all first-born sons and show that they are more probable to be homosexuals if their mothers have more children.

It would be really interesting to look at this data.Share:Facebooktwitterredditpinterestlinkedinmail

Was I Dead?

Once when I was working at Telcordia, I received a phone call from my doctor’s office. Here is how it went:

— Are you Tanya Khovanova?
— Yes.
— You should come here immediately and redo your blood test ASAP.
— What’s going on?
— Your blood count shows that you are dead.
— If I’m dead, then what’s the hurry?
Given that I wasn’t dead, the conclusion was that there had been a mistake in the test. If there had been a mistake, the probability that something was wrong after the test was the same as it was before the test. There was no hurry.Share:Facebooktwitterredditpinterestlinkedinmail

Happy Nobel Prize Winners

I stumbled upon an article, Winners Live Longer, that says:

“When 524 nominees for the Nobel Prize were examined and compared to the actual winners from 1901 to 1950, the winners lived longer by 1.4 years. Why? It seems just having won and knowing you are on top gives you a boost of 1.8% to your life expectancy.”

This goes on top of the pile of Bad Conclusions From Statistics. With any kind of awards where people can be nominated several times, winners on average would live longer. The reason is that nominees who die early lose their chance to be nominated again and to win.

I wonder what would happen if we were to compare Fields medal nominees and winners. There is a cut off age of 40 for receiving a Fields medal. If we compare the life span of Fields medal winners and nominees who survived past 40, we might get a better picture of how winning affects life expectancy.

Living a long life increases your chances of getting a Nobel Prize, but doesn’t help you get a Fields medal.Share:Facebooktwitterredditpinterestlinkedinmail

Judging the Tail

It’s easy to judge who is the fastest runner or swimmer. Judges do not need to be runners and swimmers themselves. They simply need a stopwatch and a camera.

Other competitions are more difficult to judge. Take for example the Fields medal. The judges need to be mathematicians. Since they can’t be experts in all the different areas of mathematics, they have to rely on recommendation letters. The mathematicians who write recommendation letters are biased, because they are interested in promoting their own field. The committee’s job is not simple, not the least because it involves a lot of politics. It is easy to award the medal to Grigory Perelman. He solved a high-profile long-standing conjecture. But other cases are not that straightforward.

Imagine a genius mathematician with a new vision. He or she might be so far ahead of everyone else, that the Fields committee would fail to appreciate the new concept. I wish the math community would create a list of mathematicians who deserved the Fields medal, but were passed over. As time goes by, perhaps a new Einstein will emerge on this list.

The reason the Fields committee more or less works is that the judges do not need to be as talented mathematicians as the awardees. They do not need to create mathematics, they need to understand it. And the latter is easier than the former.

A completely different story happens with IQ tests. Someone has to write those tests. There is no reason to think that writers of the IQ tests are anywhere close to the end tail of the IQ distribution. Hence, the IQ tests are not qualified to find the IQ geniuses.

IQ test

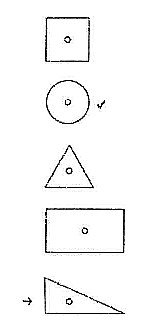
Now might be a good time to complain about the IQ test I took myself. Many years ago I tried an IQ test online through tickle.com. I was so disappointed with my non-perfect score that I never looked at my answers. Recently, while cleaning my apartment, I discovered the printout of the test. I made one mistake in the following question.

Which one of the designs is least like the other four?

The checkmark is the expected answer. They think that the circle is the odd one out because all the other shapes are polygons. The arrow points to my answer. I chose the right triangle because it is the only shape without symmetries. Who says that polygonality is more important than symmetry?Share:Facebooktwitterredditpinterestlinkedinmail

A Probabilistic Paradox

Tanya Khovanova and Alexey Radul

We all heard this paradoxical statement:

This statement is false.

Or a variation:

True or False: The correct answer to this question is ‘False’.

Recently we received a link to the following puzzle, which is similar to the statement above, but has a cute probabilistic twist:

If you choose an answer to this question at random, what is the chance you will be correct?

  1. 25%
  2. 50%
  3. 60%
  4. 25%

There are four answers, so you can choose a given answer with probability 25%. But oops, this answer appears twice. Is the correct answer 50%? No, it is not, because there is only one answer 50%. You can see that none of the answers are correct, hence, the answer to the question—the chance to be correct—is 0. Now is the time to introduce our new puzzle:

If you choose an answer to this question at random, what is the chance you will be correct?

  1. 25%
  2. 50%
  3. 0%
  4. 25%

Share:Facebooktwitterredditpinterestlinkedinmail

Too Good at Spider Solitaire

Have you ever been punished for being too good at spider solitaire? I mean, have you ever been stuck because you collected too many suits? Many versions of the game don’t allow you to deal from the deck if you have empty columns, nor do they allow you to get back a completed suit. If the number of cards left on the table in the middle of the game is less than ten — the number of columns — you are stuck. I always wondered what the probability is of being stuck. This probability is difficult to calculate because it depends on your strategy. So I invented a boring version of spider solitaire for the sake of creating a math problem. Here it goes:

You start with two full decks of 104 cards. Initially you take 54 cards. At each turn you take all full suits out of your hand. If you have less than ten cards left in your hand, you are stuck. If not, take ten more cards from the leftover deck and continue. What is the probability that you can be stuck during this game?

Let us simplify the game even more by playing the easy level of the boring spider solitaire in which you have only spades. So you have a total of eight full suits of spades. I leave it to my readers to calculate the total probability of being stuck. Here I would like to estimate the easiest case: the probability of being stuck before the last deal.

There are ten cards left in the deck. For you to be stuck, they all should have a different value. The total number of ways to choose ten cards is 104 choose 10. To calculate the number of ways in which these ten cards have different values we need to choose these ten values in 13 choose 10 ways, then multiply by the number of ways each card of a given value can be taken from the deck: 810. The probability is about 0.0117655.

I will leave it to my readers to calculate the probability of being stuck before the last deal at the medium level: when you play two suits, hearts and spades.

No, I will not tell you how many times I played spider solitaire.Share:Facebooktwitterredditpinterestlinkedinmail

Averaging Averages

Jorge Tierno sent me a link to the following puzzle:

There is a certain country where everybody wants to have a son. Therefore, each couple keeps having children until they have a boy, then they stop. What fraction of the children are female?

If we assume that a boy is born with probability 1/2 and children do not die, then every birth will produce a boy with the same probability as a girl, so girls will comprise half of all children.

Now, I wonder why everyone would want a boy? Y-chromosomes are much shorter than X-chromosomes. If a man wants to pass his genes to the next generation, a daughter should be preferable as she keeps more genes from the father. I am a mother of two boys, so my granddaughters will have my X-chromosome while my grandsons will have my ex-husband’s Y-chromosome, so to keep my genes in the pool I should be more interested in granddaughters.

But I digress. I started writing this essay because in the original puzzle link the answer was different from mine. Here is how the other argument goes:

Half of all families have zero girls, a quarter have 1/2 girls, 1/8 have 2/3 girls, and so on. If we sum this up the expected ratio of girls to boys is (1/2)0 + (1/4)(1/2) + (1/8)(2/3) + (1/16)(3/4) + … which adds to 1 − ln 2, which is about 30%.

What’s wrong with this solution?Share:Facebooktwitterredditpinterestlinkedinmail