by John H. Conway as told to Tanya Khovanova
Forty years ago, it took about 18 months for us to find the rules that eventually became the Game of Life. We thought in terms of birth rules and death rules. Maybe one day’s death rule would be a bit too strong compared to its birth rule. So the next day at coffee time we’d either try to weaken the death rule or strengthen the birth rule, but either way, only by a tiny bit. They had to be extremely well-balanced; if the death rule was even slightly too strong then almost every configuration would die off. And conversely, if the birth rule was even a little bit stronger than the death rule, almost every configuration would grow explosively.
What’s wrong with that, you might ask. Well, if the “radius” grows by 1 unit per generation, then after 9 or 10 moves, it’s off the (19 by 19) Go board. We can probably find more Go boards, of course, but after another 20 or so moves it will outflow the coffee table and then it is awfully hard to keep track. We wanted to be able to study configurations for much longer than that, which meant that we had to disallow rules that might lead to linear growth. Of course, we weren’t interested in rules that usually led to collapse.
Who were “we”? Well, I was the chief culprit and had an aim in mind — to find a simple set of rules that would lead to a system able to simulate a universal computer. Von Neumann had already shown that this was possible, but his system had 29 states and a very complicated set of rules. The rest of “us” were mostly graduate students who had no higher aim than amusing themselves. Every now and then some rather older colleagues or visitors took an interest.
So my plan was, first, to find a set of rules that almost always prevented explosive growth and catastrophic collapse. Second, I wanted to study it long enough to learn how it could be “programmed”. I hoped to find a system whose rules were much simpler than Von Neumann’s, preferably with only two states (on and off) per cell, rather than his 29.
I’ll just describe the last few rule fiddles. We had in fact given up on finding a two-state system, in favor of one with three states: 0, A, B. State 0 represented an empty cell, and it was natural to think of A and B as two sexes, but we only found their proper names when Martin Huxley walked by and said, “Actresses and bishops!”
Perhaps I should explain this. There is a British anecdote that starts like this:
“The actress sat on the left side of the bed, and removed her stockings. The bishop, on the right side of the bed, removed his gaiters. Then she unbuttoned her blouse and he took off his shirt…”
You are supposed to be getting excited, but it all ends quite tamely, because it turns out that the bishop was in his palace, while the actress was in her bedsit near the theater. There are lots of stories in England about the actress and the bishop, and if a person says something that has a salacious double meaning, it’s standard to respond “as the actress said to the bishop,” or “as the bishop said to the actress”.
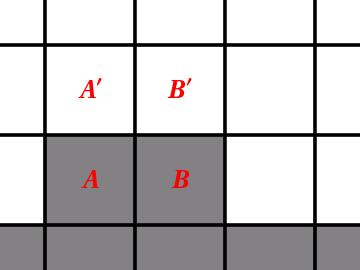
Okay, back to Life! To inhibit explosive growth, we decided to imitate biology by letting death be a consequence of either overcrowding or isolation. The population would only grow if the number of neighbors was neither too large nor too small. Rather surprisingly, this turned out to mean that children had to have three or more parents. Let’s see why. If two parents could give birth, then in the figure below, the parents A and B, who are on the border of the population, would produce children A’ and B’ at the next time step, followed by grandchildren A” and B” and so on, thus giving us linear growth!
 So we moved to threesomes. Children were born to three parents, made up of both sexes. Moreover, the sex of the child was determined by the sex of its parents — two bishops and one actress would give birth to a little actress, while two actresses and one bishop would produce a tiny bishop. This was “the weaker-sex birth rule,” and it was accompanied by “the sexual frustration death rule,” which made death the punishment for not touching somebody of the opposite sex!
However, the weaker-sex birth rule lived up to its name, by being weaker than the death rule. Remember we weren’t interested in rules that led to disappointingly swift collapses, as the actress said to the bishop. Therefore, we strengthened the birth rule by allowing same-sex conception, but again by applying the weaker-sex rule — so that three actresses would produce a bishop or three bishops an actress. However this strengthened the birth rule too much, causing us to apply the death penalty more often.
We decided to apply the death penalty to those who weren’t touching at least two other people, whatever their sex. At first sight it was not obvious that this was stronger than the sexual frustration rule, but in fact it was, because the weaker-sex rule ensured that the sexes were fairly evenly mixed, so if you were touching at least two other people, there was a good chance that one of them would be of the opposite sex.
According to our new set of rules, the sex of parents played no role except to determine the sex of the children, so we abolished sex. After all, according to the bishop, Life without sex is much cleaner.
This is now called the Game of Life and these rules, at last, turned out to be clean and well-balanced.
Share:


 Sergei Bernstein and Nathan Benjamin brought back a variation of the “Rock, Paper, Scissors” game from the Mathcamp. They call it “Rock, Paper, Scissor.” In this variation one of the players is not allowed to play Scissors. The game ends as soon as someone wins a turn.
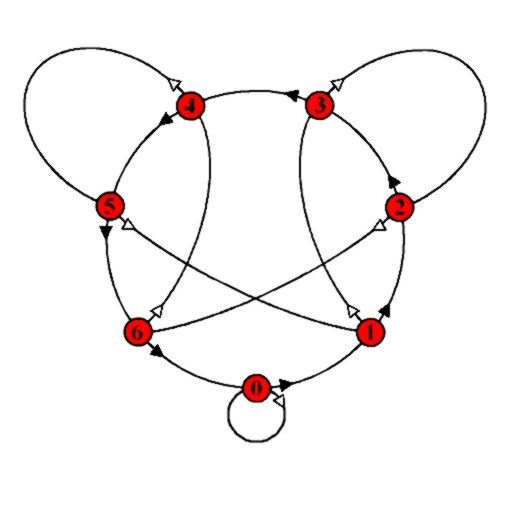 The graph is used in the same way as the first graph. To find the remainder on dividing a number by 7, start at node 0, for each digit D of the number, move along D black arrows (for digit 0 do not move at all), and as you pass from one digit to the next, move along a single white arrow.
 I am a milk person. I can easily drink half a gallon of milk a day. The problem with half a gallon of milk a day is that it is about half of my target calorie intake. That is why I switched to the reduced-fat milk. It didn’t taste good, but I was very proud of myself. That is, I was proud for about a year until I finally decided to read the labels. One serving of whole milk is 150 calories, while one serving of reduced-fat milk is 130 calories. All this year-long suffering saved me an insignificant 13%. Not to mention that the amount of sugar is the same.