Puzzling Grades Resolved
This story started when my student asked for an explanation for his grade B in linear algebra. He was slightly above average on every exam and the cut-off for an A was the top 50 percent of the class. I wrote a post in which I asked my readers to explain the situation. Here is my explanation.
The picture below contains histogram for a typical first midterm linear algebra exam.
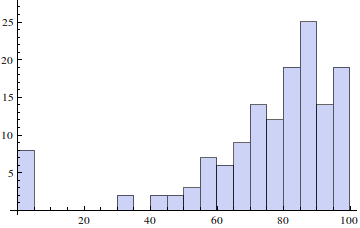
The spike in the lowest range indicates zeros for those who missed the exam.
The mean is 74.7 and the median 81.5. As you can see the median is 7 points higher than the mean. That means that if a student performs around average on all the exams, s/he is in the bottom half of the class.
But this is not the whole story. In addition to the above, MIT allows students to drop the class after the second midterm. Suppose 30 students with lower grades drop the class; then the recalculated median for the first midterm for the students who finish the course goes up to 85. This is a difference of more than 10 points from the original average.
If this was a statistics class, then I could have told the puzzled student that he deserves that B. Instead I told him that he didn’t even have the highest score among those with Bs. Somehow that fact made him feel better.
Share:
tanyakh:
test captchas
30 April 2015, 7:56 pmtanyakh:
test
30 April 2015, 7:56 pmtanyakh:
my captchas do not work
30 April 2015, 7:59 pm